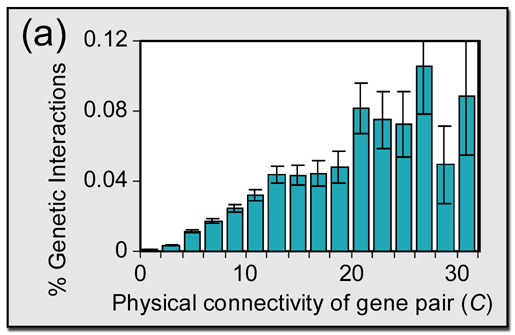
In Figure 1(a) of the paper, we display:
-
Frequency of genetic interaction (percent +/- stderr) versus
degree of physical connectivity C, binned over all gene
pairs in the network.
The trend is apparent; as hub size goes up, the percent of genetic interactions that are realized also goes up. The frequency in a particular bin is calculated by tallying the number of genetic interactions that fall in the appropriate connectivity range, and dividing by the number of pairs of genes, whether interacting or not, that fall in that range.
We also note that:
-
The overall correlation is preserved when essential genes are
excluded from the network; whether supressor or synthetic lethal
interactions are examined separately or pooled; or if C
is computed using an arithmetic instead of geometric mean
(data not shown).
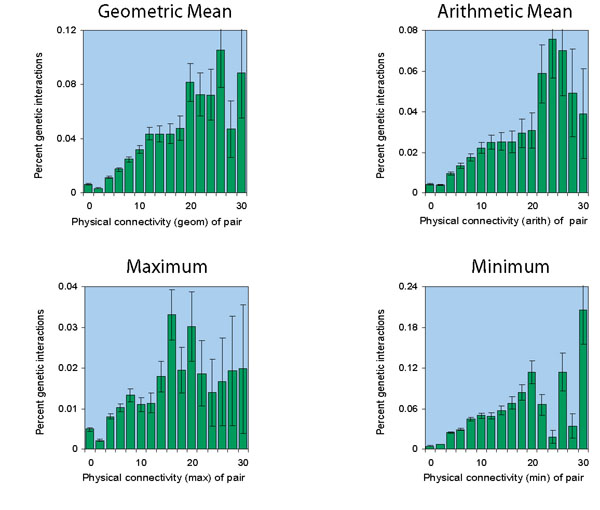
Different connectivity metrics
Below, data is shown for the same network (Dip
plus MIPS plus SGA, but really, with
the sixteen extra genetic interactions removed, as described
here.) under different connectivity metrics:
(here is the text of the raw data.)
Note that the vertical scale is different for each of the charts.
Excluding essential genes
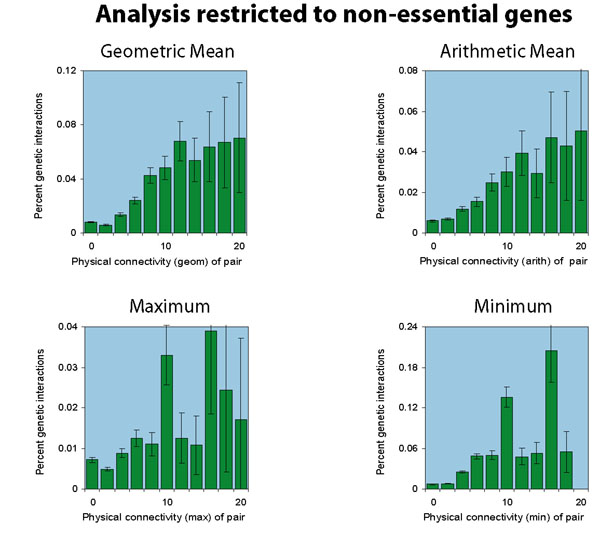
We also consider excluding essential genes from the network.
We list 1105 essential genes, and
exclude them from the network, resulting in
a network about half the size of the
original, now including 6984 protein-protein interactions and
632 genetic interactions. Performing the analysis again, we find
a smaller sample set, but similar results:
(here is the text of the
raw data.)
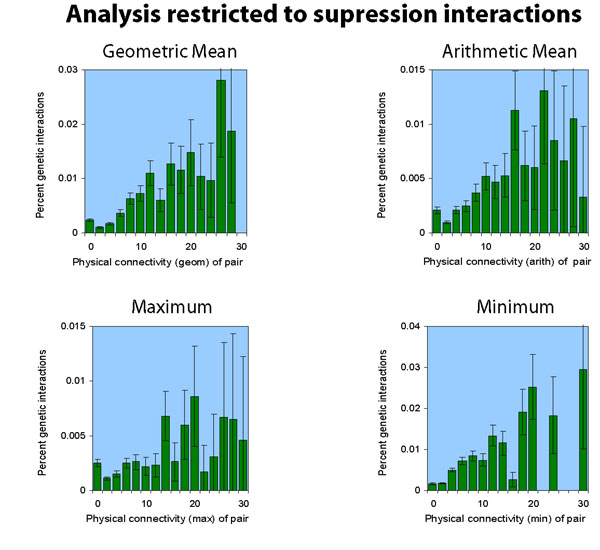
Synthetic Lethals vs Supressors
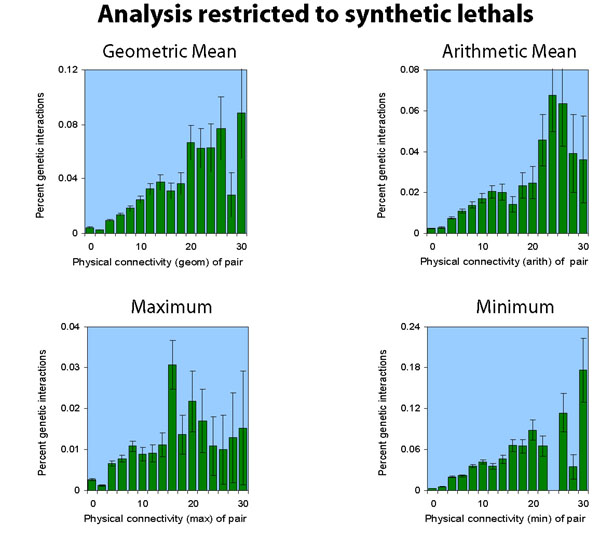
Of the 1312 genetic interactions we examined, 1007 were synthetic
lethal interactions, and 305 were suppressor interactions. The analyses
above consider the two together. Here, we show the result of considering
them separately.
Note that the suppression interactions analysis is much noisier, because there are fewer interactions to analyze (305 suppression versus the previous 1007 synthetic lethal).
[ the synthetic lethal analysis network | the suppression analysis network ]
[ text of the synthetic lethal analysis raw data | text of the suppression analysis raw data ]
After having seen all these results, we thought the most consistent and illustrative metric was the geometric mean, and that the enrichment of genetic interactions among more highly connected node pairs appeared robust to a variety of different data sets, connectivity metrics, etc.
