In the paper, we consider that the evident bias of genetic interactions toward hubs could have at least two underlying explanations:
-
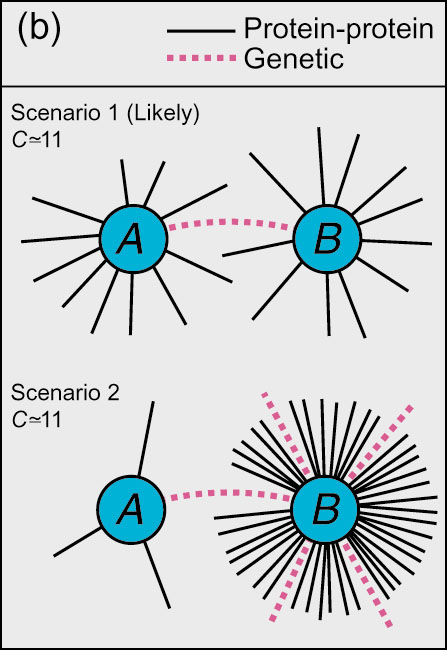
Figure 1(b): Possible interpretations for Fig 1a. In scenario 1, physical interaction hubs (A and B) are biased to genetically interact with each other; in scenario 2, hubs (B) genetically interact with many partners (A) of both low and high physical connectivity.
We model the expectation in scenario 2 as follows:
-
If hubs are nonbiased (scenario 2), then the expected number of genetic
interactions between hubs is g.(n choose 2) /
((n choose 2) + n . m), where n,
m, and g are the numbers of hubs, non-hubs, and genetic
interactions involving a hub, respectively, for a particular hub size
h.
A Null-Hypothesis: Scenario 2 hub bias
There are three types of genetic interactions in our
ontology, given a particular hub size h: Hub-Hub, Hub-Leaf (or
Leaf-Hub), and Leaf-Leaf. These three categories actually apply to
all pairs of genes, whether or not they genetically interact.
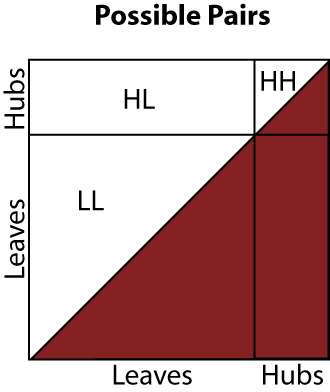
Above, we show the space of possible pairs of genes, delineated according to whether the genes are hubs or leaves. The bottom right half of the square is shaded (red) because it contains only duplicates of pairs that appear in the upper left half.
In our most basic model of a hub bias (scenario 2), we take the probabiliy density to be constant with one density in the area labeled LL, and constant with another, higher, density in the areas labeled HL and HH. Thus, under this model, we can make a prediction, and compare it to our actual observations.
Given the number of genetic interactions involving a hub is g; the number of hubs is n; and the the number of non-hubs is m: g is the number of genetic interactions in regions HH and HL, so the number of genetic interactions that occur in region HH should be equal to g multiplied by the proportion of the HH+HL area that HH occupies. There are m . n pairs in area HL, and there are (n choose 2) pairs in area HH, so the proportion is simply (n choose 2) / ((n choose 2) + m . n), and thus, our prediction for the number of hub-hub interactions is:
-
g . (n choose 2) / ((n choose 2) +
m . n)
-
g . (n - 1) / (2m + n - 1)
Based on the data above, we reject Scenario 2 in favor of a model more like Scenario 1, as shown below.
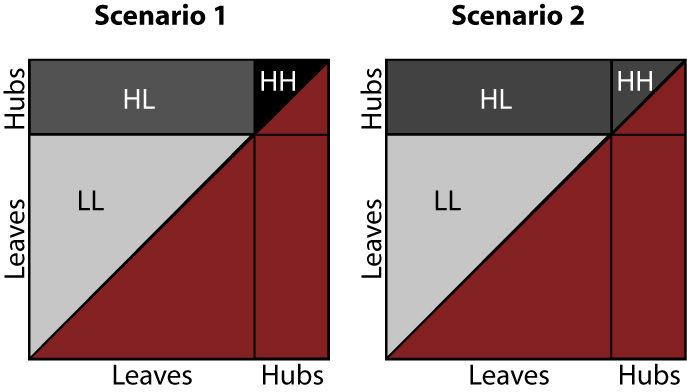
The above figure shows probability density as darkness in each area, LL, HL, and HH. The (red) shaded area in the lower right half of each square still indicates a region that would be double-counting, which we therefore ignore.
Comparing to the physical network
Maslov and Sneppen report that
- ...for both interaction and regulatory networks, links
between highly connected proteins are systematically
suppressed, whereas those between a highly connected and
low-connected pairs of proteins are favored.
Yet we do observe a bias towards hub-hub interactions, relative to the hub-leaf interactions. This is the Scenario 1 from the earlier chart; how do we reconcile this with Maslov and Sneppen's finding?
Maslov and Sneppen vs Scenario 2
Maslov and Sneppen randomize in the following way:
- To test for correlations in connectivities of nodes... we calculated
the likelihood P(K0,K1) that two
proteins with connectivities K0 and
K1 are connected to each other by a link and
compared it to the same quantity
Pr(K0,K1)
measured in a randomized version of the same network. In this
"null model" network, all proteins have exactly the same
connectivity as in the original one, whereas the choice of their
interaction partners is totally random.
Of the possible pairs of genes, (discounting self-loops, (60 choose 2) = 30 . 59 = 1770), (10 choose 2) = 45 are hub-hub pairs; 10 . 50 = 500 are hub-leaf pairs; (50 choose 2) = 25 . 49 = 1225 are leaf-leaf pairs. 1225 + 500 + 45 = 1770. Of the hub-hub pairs, one could crudely estimate that 12.5/45 would be realized (28%); of the hub-leaf pairs, 50/500 would be realized (10%); of the leaf-leaf pairs, 12.5/1225 would be realized (1%). This is clearly more like scenario 1 than scenario 2. (This is also a crude estimate, since the issues of self-loops and double-counting of interactions are not carefully handled.)
This much more closely resembles a different model:
Another model
Assume the selections of the two endpoints of a genetic interacion
are independent. Estimate the probability of an endpoint being a hub
by taking all genetic interactions, tabulating whether their endpoints
fall on hubs or not, and calculating a percentage. In the case of
the Maslov and Sneppen vs Scenario 2 example above, half the
endpoints would be on hubs, half on leaves. In this case, we predict
exactly what Maslov and Sneppen's scrambling produces, and in their
randomized networks, we observe no hub-hub enrichment.
In fact, when we superimpose the physical network on itself, and check for the ratio of observed to expected hub-hub interactions using this model, we get a very different chart: See the lower right panel of the figure below, labeled "Physical vs physical, new model."
We actually observe fewer hub-hub interactions than expected under this model, which is exactly what Maslov and Sneppen report.
Applying the new model to the genetic interaction network
When we apply this model to the genetic interaction network, superimposed
on the physical interaction network, we observe the following chart:
See the lower left panel of the figure below, labeled
"Original genetic data, new model."

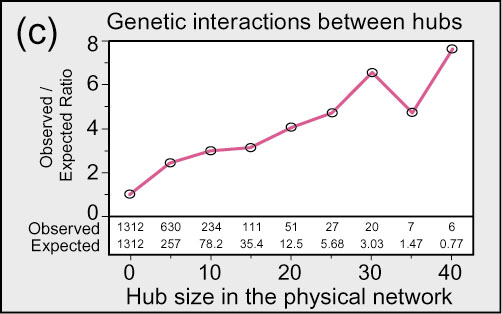
So it appears that this new model, which selects the endpoints of genetic interactions independently with a bias toward hubs, does a much better job of explaining the genetic interactions than the original Scenario 2. This new model is much like Scenario 1, but even still, genetic interactions occur between hubs more frequently than the new model would predict. At many hub thresholds, this enrichment is not statistically significant, but in several instances it is (hub cutoffs 20, 25, and 30). This preference towards hub-hub interactions (lower left panel of figure above) is contrasted with the physical network's own preference away from hub-hub interactions (lower right panel of figure above), consistent with Masolv and Sneppen's observation. Even using the Scenario 2 test, we can see that the tendency towards interactions between physical hubs is stronger in the genetic network than in the physical network itself (upper left vs upper right panels of figure above).